Google Ads Campaign Performance
Campaign-level breakdown of impressions, clicks, CTR, CPC, cost and conversions. Highlights top performers and budget inefficiencies.
Platforms
Monitors
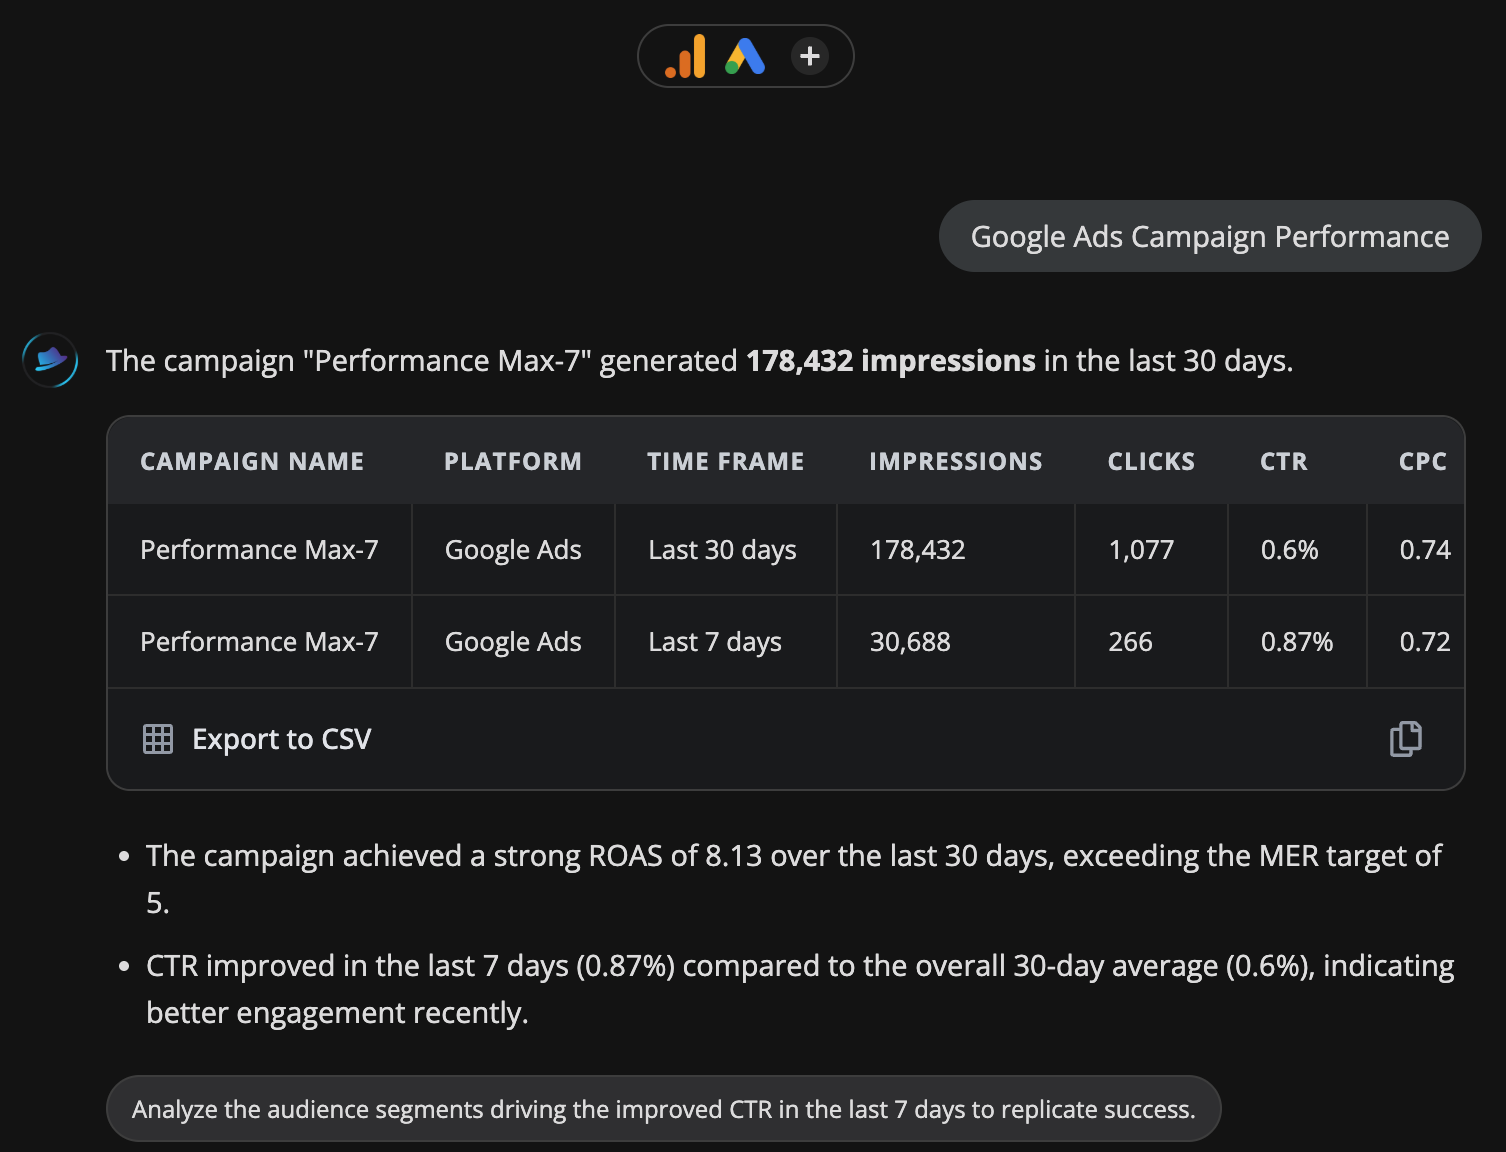
NameAdvertising channel typeImpressionsClicksCtrAverage cpcCost microsConversions
Time range
LAST 30 DAYSLAST 7 DAYS
Frequently asked questions
What metrics does this playbook show?
Impressions, clicks, CTR, average CPC, cost, conversions and cost per conversion at the campaign level for the last 30 days. It also flags your best and worst performers against the account average.
How do I know if my CTR is good?
Search campaigns usually run 3-5% CTR; Display sits at 0.5-1%; Performance Max varies widely by vertical. The playbook compares each campaign against your own account average, which is a more useful benchmark than industry numbers.
What does a high CPC with low conversions mean?
You are paying competitive prices to show your ads but the traffic is not converting. Usually the fix is landing page or offer mismatch, not bid strategy. Run the Analyze Landing Pages playbook to diagnose further.
Should I pause campaigns with zero conversions?
Not immediately. First check conversion tracking. A broken tag can make a working campaign look like a failure. If tracking is fine and spend is significant with no conversions over 30 days, pause or restructure.
Does this show Performance Max campaigns?
Yes. Performance Max shows up alongside Search, Display and Shopping. PMax is a black box: campaign-level data is all Google exposes, so this is the deepest view possible.